To say I’ve been on a long hiatus since my last post would be an understatement. During that time, I snagged a Master’s and PhD in Computer Science, moved into a couple new positions at UNH, and worked on a number of projects. Things have been busy to say the least, but now that a semi-normal schedule is finally starting to return to my life, I really want to focus on things that are fulfilling and meaningful. One of these things is dedicating time to personal projects again and sharing them with the community. I love seeing what other folks are working on, and I want to contribute and give back as well. I have a new game I’ve been working on for the last six months that I hope people will really enjoy playing, and allow them to create their own virtual experiences in a very RETRO style. More details on that very soon!
In the meantime, I wanted to share two tutorial videos that might be able to help folks in the bioinformatics community. The first is a video on how to use PALADIN, a tool for characterizing metagenome shotgun data (see paper here). The second is a video on using the Linux program tmux, a tool for multiplexing multiple terminal sessions. Very useful for those who spend all day in a terminal window like myself!
I think one of the things I love about attending grad school so much is all the opportunity for collaboration – especially across disciplines. To be surrounded by so many people with passion for these different topics, all working toward discovery and creation – it’s really an amazing experience. One particular interdisciplinary area I’ve fallen in love with is bioinformatics. I’ve had interest in computational biology for a long time, as can be seen with my work with SynthNet – but this has been my first opportunity to work first hand with others in these areas – as well as experts squarely in the biology fields, which has been an extremely helpful learning experience.
Enter Bioinformatics
I’ve found bioinformatics, genomics, proteomics, etc to be especially interesting, as there are such a ridiculous number of inherent parallelisms between what occurs in nature and what we’ve discovered and devised in Computer Science. Obviously the underlying Turing-complete, algorithmic nature of things drives them both, but it’s still awe inspiring to see these processes in genetics happening naturally, and then be able to make predictions using the same rules that one would in CS.
PALADIN: software for rapid functional characterization of metagenomes
One such area in bioinformatics that we’ve been focused on for the last 6 months or so is the problem of identifying genes/proteins from metagenomic read sets. In a metagenomic sample, you have many organisms present, perhaps thousands – all these small pieces of DNA mixed together – and it presents a problem when you want to actually identify what was in there. Or more aptly, in our case, the function of what was in there. I love making the analogy to taking 500 different jigsaw puzzle boxes, opening them up, and dumping them all together. To make things worse, though the puzzles are different, some of them feature a lot of the same themes – flowers, grass, sky, etc. But let’s step it up – you also lose some pieces in the process, some get damaged and misshaped, and there are duplicates of others. Now try reconstructing all 500 puzzles – not so easy!
While there are lots of strategies and ways for computers to “reconstruct these puzzle pieces”, so to speak – many of them are slow and have inherent issues. We attempt to solve these speed and other issues with our new software, PALADIN, that I’ve been lucky enough to be the lead developer of, though it’s a 100% team effort for this kind of project
I won’t go into the full details of the software here, but if you’d like to learn more about it, our team, and details on the upcoming manuscript, you can read more about it on Professor Matt MacManes’ blog post.
First year of grad school done, second one about to start! It’s been an absolutely amazing experience so far – more to come about the bioinformatics aspect of it in future posts.
For this post, I wanted to discuss one of the plugins I developed during my scientific visualization class, and my newfound (at that time) love for the VTK framework and ParaView.
Visualize Everything!
If you haven’t encountered it before, VTK (Visualization Tool Kit) is a framework developed by Kitware for handling the entire pipeline process from consuming organized data, processing, filtering, visualizing, and/or exporting. They’ve also developed an accompanying GUI application for easily manipulating VTK, called ParaView. Both of these packages have been around for many years, but I had (unfortunately) not been exposed to them until my class – however, after using the software for a short time, I quickly realized how ridiculously powerful the framework is, and I really wanted to do more work with it.
The UNH Granite Scientific Database System
Being an open source pipeline, one of the places VTK shines is in its modularity and expandability – almost every part of the pipeline can call a custom plugin. I decided to take advantage of this – UNH has a custom Java library named The Granite Scientific Database System (Granite SDB), which provides a comprehensive set of classes for accessing multidimensional scientific data. It was originally developed, and continues to be maintained by, UNH Professor Daniel Bergeron, and has been expanded over the years by a number of students. While it is very powerful in its capabilities, it is designed strictly as a processing and storage library – it leaves the actual visualization routines to the developer. With this in mind, I thought it would be a perfect match to write a Granite plugin for ParaView.
Single Resolution Data
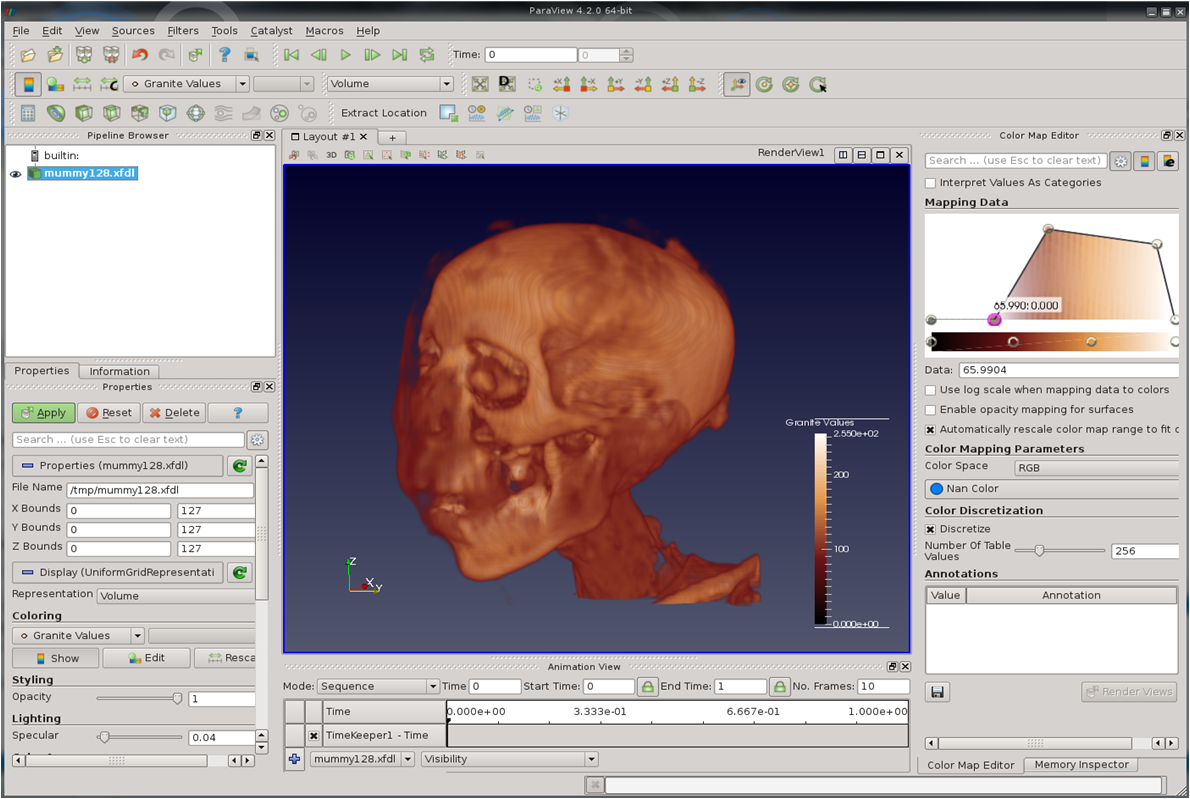
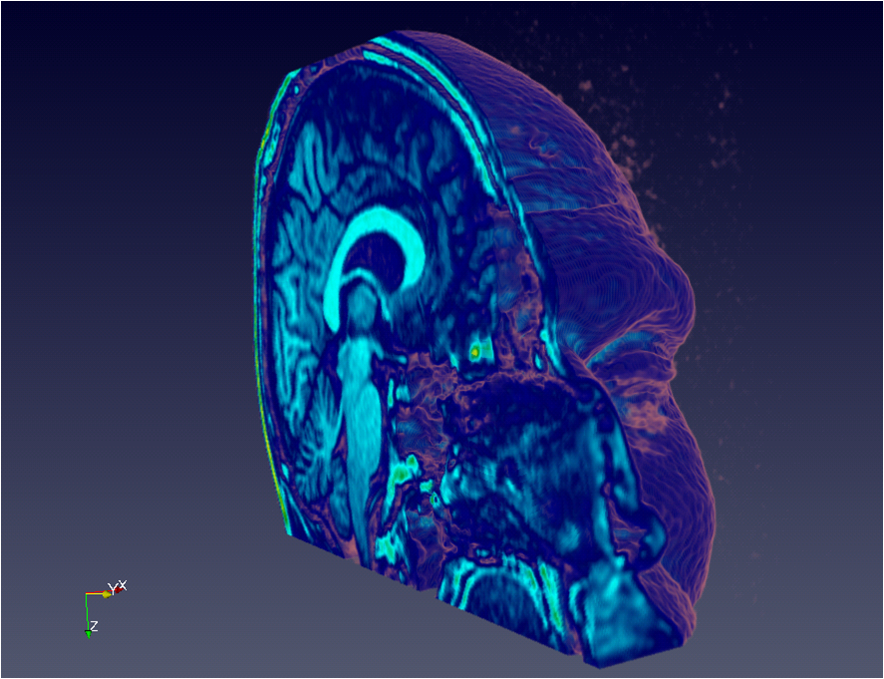
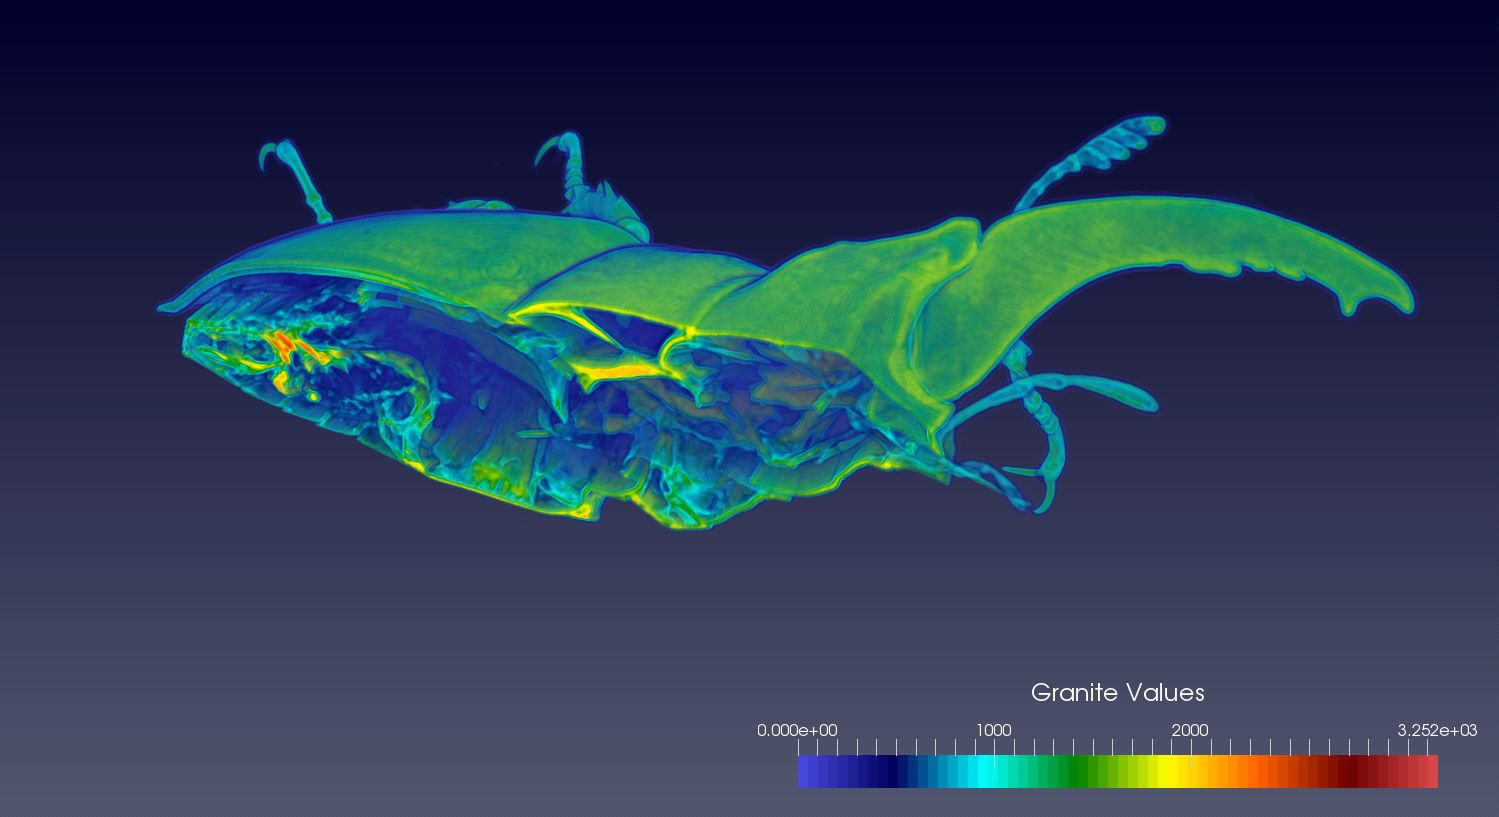
Before diving head first into the full capabilities of VTK, I decided to start with a simple read plugin for working with single resolution data. Since there are such a large number of medical images/datasets available in on the net (CT and MRI scans), especially in DICOM format, I decided to start with loading this data into Granite, and then seeing if I could visualize this with ParaView via the plugin. After only a few days, I was able to get perfect results! Here are some examples of sets loaded through the plugin:
Mummy (CT)
Head (MRI)
Beetle (Micro CT)
Cool stuff! With that working, I wanted to tackle more…
Multi and Adaptive Resolution
One of the challenges when visualizing data, especially large amounts of data, are the limitations of the underlying hardware. By necessity, different methods must be employed to only visualize the relevant portions, whether it be the amount rendered, areas rendered, streaming portions at a time, etc. Along these lines, VTK offers a newer portion of the pipeline that allows for streaming blocks of overlapping data at different resolutions. In this way, only specific areas (dependent on the viewport focus – direction and zoom) will be rendered, and done so in a streaming manner, so the user can continue to manipulate the program while searching for areas of interest in the render.
Long story short, the following video is the end result of the plugin supporting overlapping AMR. In this demo, the plugin resets the visualization every time the camera is rotated to demonstrate clearly how it operates. As can be seen, the data starts out at a very low resolution for quick rendering, then continues to resolve to higher and higher resolutions, centered around the area being viewed, as data is streamed from the Granite, through the plugin, into VTK. I used the same mummy CT scan as shown above.
Hello - and thanks for visiting my site! I maintain ToniWestbrook.com to share information and projects with others with a passion for applying computer science in creative ways. Let's make the world a better and more beautiful place through computing! | More about Toni »