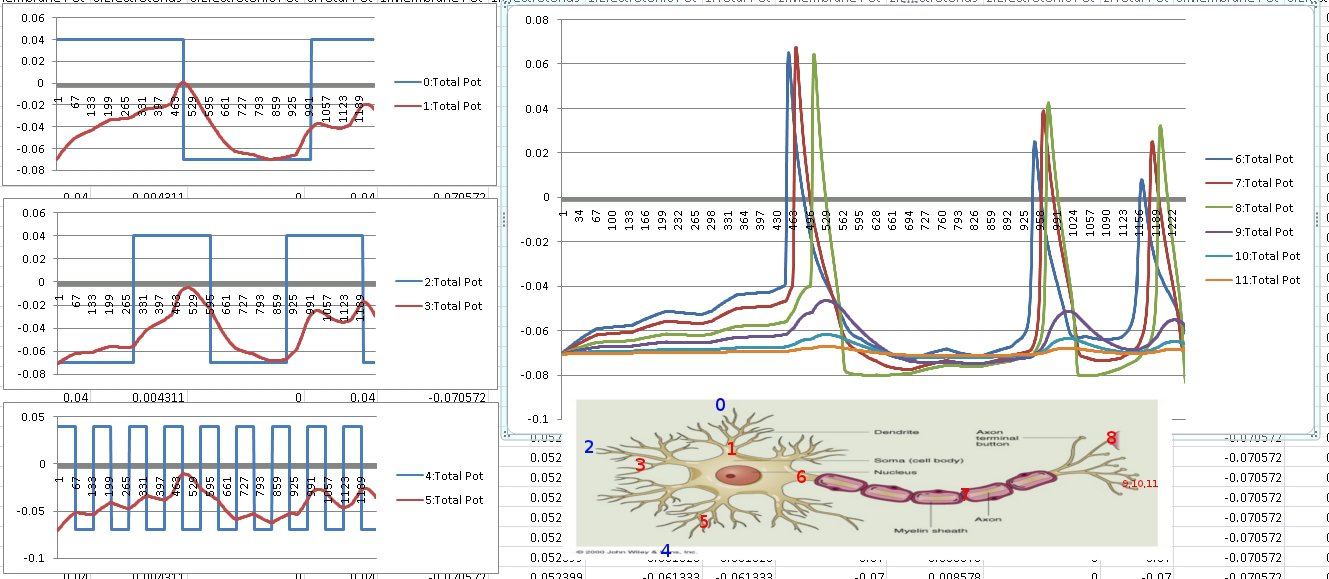
Pictured here are the membrane potential graphs from a complete virtual neuron from SynthNet. This neuron was comprised of 3 dendritic structures of smaller diameter, a larger soma, and a hillock and long axon.

On the drawing, I labeled what point on the representation neuron each graph pertains to. You can see me feeding high frequency, medium frequency, and low frequency oscillating voltage into the dendritic arbor at different points, and then you can see them temporally and spatially summating at the axon hillock until they hit -40mV, which then triggers an action potential down the axon, which propagates from segment to segment all the way down (See the three spikes very close to each other – thats the pulse moving down the axon). I keep the oscillation up and trigger 2 more action potentials too after the refractory period is over. You can also see the backpropagation of voltage go back through the soma into the dendrites where retrograde messengers will be released (see the jump back on the dendrites around time 500, in relation to getting electrotonic current from the axons).
This demonstrates the proper interaction between electrotonic potential, membrane potential, and ionic current flow.
 Hello - and thanks for visiting my site! I maintain ToniWestbrook.com to share information and projects with others with a passion for applying computer science in creative ways. Let's make the world a better and more beautiful place through computing! | More about Toni »


Leave a Reply