When I want to learn a new technology or technique, I like to think about little projects I’ve always wanted to try, and see if the project could be implemented using the new technology.
In this case, I’ve worked quite a bit with .NET’s image and graphic related classes and methods, but had never really investigated the PHP equivalent. After reading up on PHP’s GD library, I decided to give writing a simple graphing calculator a go.
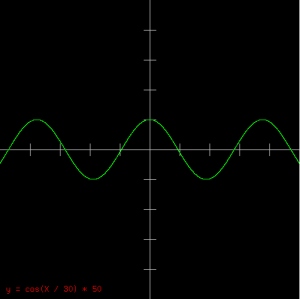
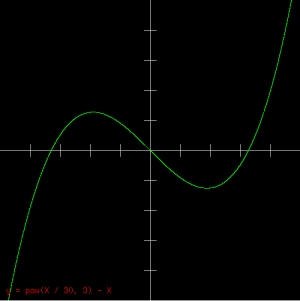
This tutorial will get you started and allow your users to enter in equations to generate graphs like this:
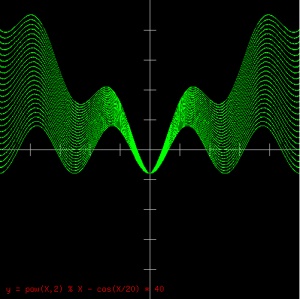
It will also let users use standard PHP functions and code, giving them use of the full math library, modulus, random functions, etc. You can do some really neat things like this:
So let’s get started. In this example, the webpage has a single text box that takes an equation, submits back to the page, and the PHP writes an image directly to the browser. Please note, this example doesn’t do any error checking or sanitation of input – please include it in your final code, especially since this page makes use of the “eval” function which is a huge security risk.
< ? php
if ($_POST['tempBox'] != '')
{
   // width, height, and scale of graph.  These could also be user defined values.
   $GLOBALS['width'] = 500;
   $GLOBALS['height'] = 500;
   $GLOBALS['scale'] = 1;


   // drawGrid draws X and Y axis with markers every 50 points
   // We pass in the image resource to draw to
   function drawGrid($passGraphic)
   {
      // Grid is grey
      $gridColor = imagecolorallocate($passGraphic, 200, 200, 200);

      // Draw two lines, one vertical in the middle of the grid (width/2)
      // and another horizontal in the middle of the grid (height/2)
      imageline($passGraphic, $GLOBALS['width']/2, 0, $GLOBALS['width']/2, $GLOBALS['height'], $gridColor);
      imageline($passGraphic, 0, $GLOBALS['height']/2, $GLOBALS['width'], $GLOBALS['height']/2, $gridColor);

      // Draw a marker ever 50 points on the X axis.  We do this by starting at the center
      // of the board, then incrementing 50 with every iteration.  We also
      // draw a mark in the mirror location to cover the negative side of the axis
      for ($lcv = 0 ; $lcv < $GLOBALS['width'] / 2 / $GLOBALS['scale']; $lcv += 50)
      {
           // Set tempX and tempY to the current marker location
           $tempX = $lcv;
           $tempY = 0;

           // Convert to image coordinates
           cartToPixels($tempX, $tempY);

           // Draw the line
           imageline($passGraphic, $tempX, $tempY - 10, $tempX, $tempY + 10, $gridColor);

           // Now do the same for the negative side of the axis
           $tempX = $lcv * -1;
           $tempY = 0;
           cartToPixels($tempX, $tempY);
           imageline($passGraphic, $tempX, $tempY - 10, $tempX, $tempY + 10, $gridColor);
      }

      // We use the same method for drawing markers on the Y axis.
      for ($lcv = 0 ; $lcv < $GLOBALS['height'] / 2 / $GLOBALS['scale'] ; $lcv += 50)
      {
           $tempX = 0;
           $tempY = $lcv;
           cartToPixels($tempX, $tempY);
           imageline($passGraphic, $tempX - 10, $tempY, $tempX + 10, $tempY, $gridColor);
           $tempX = 0;
           $tempY = $lcv * -1;
           cartToPixels($tempX, $tempY);
           imageline($passGraphic, $tempX - 10, $tempY, $tempX + 10, $tempY, $gridColor);
      }


   }

   // cartToPixels converts Cartesian coordinates to image coordinates, using the SCALE variable to
   // do a zoom conversion between the two.
   // The two gotchas are, coordinates start from the center, and the Y axis goes in the
   // opposite direction (image coordinates, increase in Y goes down.  Cartesian, increase
   // in Y goes up).
   function cartToPixels(&$passX, &$passY)
   {
      // Start from the middle, otherwise 1 to 1 for X
      $passX = $GLOBALS['width'] / 2 + $passX * $GLOBALS['scale'];

      // Start from the middle, also subtract to flip for Y
      $passY = $GLOBALS['height'] / 2 - $passY * $GLOBALS['scale'];

   }

   // pixelsToCart converts from image coordinates to
   // Cartesian coordinates.  Uses the same process as
   // above but reversed.
   function pixelsToCart(&$passX, &$passY)
   {
      $passX = ($passX - $GLOBALS['width'] / 2) / $GLOBALS['scale'];
      $passY = ($passY + $GLOBALS['height'] / 2) / $GLOBALS['scale'];
   }

   // The plot function simply takes Cartesian coordinates and
   // plots a dot on the screen
   function plot($passGraphic, $passCartX, $passCartY)
   {
      // We use green for our graphs
      $plotColor = imagecolorallocate($passGraphic, 0, 255, 0);

      // Convert Cartesian coordinates to image coordinates
      cartToPixels($passCartX, $passCartY);

      // Then draw a dot there
      imagesetpixel($passGraphic, $passCartX, $passCartY, $plotColor);
   }

   // Push out an image/png mime type to the browser so it knows
   // a PNG image is coming and not HTML
   header ("Content-type: image/png");

   // Create a new image resource with the dimensions dictated
   // by our width and height globals.  Starts off with a black
   // background automatically.
   $im = @imagecreatetruecolor($GLOBALS['width'], $GLOBALS['height'])
      or die("Cannot Initialize new GD image stream");

   // Draw the grid on our graph first (under everything)
   drawGrid($im);

   // We start a loop from 0 (First pixel in width of graph) to the width end,
   // converting image X coordinate to Cartesian X coordinate, then retrieving
   // the corresponding Y Cartesian coordinate (remember, our equations are
   // in 'y =' form.  We multiply it by 50 to give a better resolution - e.g. multiple dots on
   // the Y axis for each X.  This gives us a solid line instead of a bunch of dots for steep
   // functions.  The higher the number, the smoother the line (and the slower the program)
   for ($lcv = 0 ; $lcv < $GLOBALS['width'] * 50 / $GLOBALS['scale'] ; $lcv++)
   {
      // Get the left most point on the graph in Cartesian coordinates
      $tempX = 0;
      $tempY = 0;
      pixelsToCart($tempX, $tempY);

      // Now get the current Cartesian X coordinate by adding our current loop
      // value divided by 50
      $tempX += $lcv/50;

      // Here's where the magic happens.  In a nutshell, we're setting the Y coordinate
      // ($tempY) in relation to the current X coordinate ($tempX)
      // by using the expression specified by the user.  We use PHP's eval function,
      // which allows us to take a string (the user's input box) and run it as if it
      // were PHP code.  We're also converting X to $tempX because that's the actual
      // name of our X variable in our code, not just
      // 'X' - but we don't want the user to have to type '$tempX', so we make it easy for
      // them.  This is the line of code to be especially careful of, as a user could insert
      // malicious PHP code and do bad things.
      @eval("\$tempY = " . str_replace('X', '$tempX', $_POST['tempBox']) . ";");

       // Now that we have both coordinates, we plot it!
      plot($im, $tempX, $tempY);
   }

   // We write the equation on the graph in red
   $textColor = imagecolorallocate($im, 255, 0, 0);

   // Now write the equation on the graph
   imagestring($im, 4, 10, $GLOBALS['height'] - 25, 'y = ' . $_POST['tempBox'], $textColor);

   // Output a PNG file now that it's all built
   imagepng($im);

   // Free up the resource
   imagedestroy($im);
}
else
{
? >

<html>
   <body>

      <div style="margin-bottom:20px; font-weight:bold; font-size:16px">Simple Grapher</div>

      <form id="graphForm" action="?< ? php echo rand(); ? >" method="post">
         Enter expression: y = <input type="input" id="tempBox" name="tempBox"> <input type="submit" value="Graph!">
      </form>

      <div style="margin-bottom:15px">Enter expression using variable X (PHP code accepted).  Both axes in range of -250 to 250.</div>
      <div>Examples:
         <ul>
            <li><a href="javascript:populate('cos(X / 30) * 50')">cos(X / 30) * 50</a></li>
            <li><a href="javascript:populate('pow(X / 30, 3) - X')">pow(X / 30, 3) - X</a></li>
            <li><a href="javascript:populate('pow(X, 2) / 15 - 200')">pow(X, 2) / 15 - 200</a></li>
            <li><a href="javascript:populate('2000 / X')">2000 / X</a></li>
            <li><a href="javascript:populate('tan(X/ 25) * 20')">tan(X/ 25) * 20</a></li>
            <li><a href="javascript:populate('-3 * X + 50')">-3 * X + 50</a></li>
            <li><a href="javascript:populate('rand() % X')">rand() % X</a></li>
            <li><a href="javascript:populate('pow(X,2) % X - X')">pow(X,2) % X - X</a></li>
            <li><a href="javascript:populate('pow(X,2) % X - cos(X/20) * 40')">pow(X,2) % X - cos(X/20) * 40 (favorite)</a></li>
         </ul>
      </div>
   </body>
</html>

< script type="text/javascript">

   function populate(passExpression)
   {
      document.getElementById('tempBox').value = passExpression;
      document.getElementById('graphForm').submit();
   }

< /script>

< ? php
}
? >
That’s it – a few things to note: We tack on a random value to the URL (check out the form code in the HTML section) to ensure our browser doesn’t show a cached copy of the image. Since its always using the same filename, the browser would almost certainly show old copies unless a refresh was requested or cache was cleared (depending on the browser).
As you might have seen from the code, generating images is very easy in PHP. We can create a new image resource using the imagecreatetruecolor function. This creates a blank resource, we can also create from preexisting images. Once we have an image resource, we can perform basic graphic functions on it like lines, dots, fill, text, etc. Once we’re done, the imagepng function can convert it into actual PNG binary code (in our case we dump it to the browser, but you can specify a filename too to save it to).
It’s definitely fun to play around with the graphic library, you can do a lot of neat things and add some needed graphics to normally text-only server side output. Have fun!

 Hello - and thanks for visiting my site! I maintain ToniWestbrook.com to share information and projects with others with a passion for applying computer science in creative ways. Let's make the world a better and more beautiful place through computing! | More about Toni »


Awesome script! Is there any way to reduce the range in which it plots the graph?
Thanks! The code above doesn’t offer changing the range of the plot, but there are some comments in the cartToPixels and pixelsToCart functions that describe using a coefficient to alter the range plotted. By adding a user defined coefficient to each calculation in those two functions, you could zoom in/out on the graph pretty easily.
I was looking for such script for ages. Thank you.
I’m interested in expanding the x and y ranges of your graph…
Getting the additional ticks on the y and x axis is easy:
for ($lcv = 0 ; $lcv < $GLOBALS['width']/2*$scale; $lcv += 50)
for ($lcv = 0 ; $lcv < $GLOBALS['height']/2*$scale; $lcv += 50)
& Converting functions:
pixelsToCart()
$passX = $scale*$passX – $GLOBALS['width'] / 2;
$passY = $scale*$passY + $GLOBALS['height'] / 2;
cartToPixels()
$passX = $GLOBALS['width'] / 2 – $scale*$passX;
$passY = $GLOBALS['width'] / 2 + $scale*$passY;
However, the graph only plots to the original stopping and starting area of the default graph.
You’re almost there – I’m about to update the code above to make use of a scaling global variable, where scale > 1 zooms in, and scale < 1 zooms out. I think it's right, its been a while since I worked on this so I might have missed something.
Okay, second question for you…
Say I wanted to display on the graph only the region between (x_1,y_1) and (x_2,y_2). So, instead of graphing 5 up, 5 down, 5 right, & 5 left, I only want to graph the region enclosed in 5 up, 0 down, 10 right, 0 left [so the first quadrant with a window of xmax = 10, xmin = 0, ymax = 5, & ymin = 0]. The modifications that would be performed on the code to obtain this would involve changing the lcv & removing the short cut of taking the opposite of *blank* value when drawing the grid. Though, I think there is an assumption made to simplify the cartToPixels and pixelsToCart function that there always exists (0,0)?
Hi Toni!
I know this is a weird place to post to you but I love your tutorials! (Just finished the game tutorial for blackberrys) and I was wondering if you could post a tutorial on creating a PHP / HTML server side programming that can connect to the blackberry in a response/request form so you can get data from a database on the server through “GET” with your blackberry? Or lead me in the right direction 😛 thanks in advanced :).
Hello, I would like to know if there is an updated version of this script?