Though I haven’t updated the blog in a while, I’ve really been going full-steam on the neural emulator. I’ve been taking screenshots as I go, so over the next day or so I’m going to try to make a few posts with those shots to get everything up to speed on the blog. Also, thanks for all the comments on other posts! I’ll be getting back to them soon (this weekend).
The first big update concerns processing electrotonic potential across the cell and the plasma membrane. In my previous post, I talked a bit about using the cable equation for distribution of current. As of now, I still make use of the cable equation for distributing potential across the cell. This takes into account the length and circumference of the segment in question, in addition to internal resistance, and resistance across the plasma membrane. Also, in order to appropriately address membrane moieties, calculations will also take into account the capacitance of the membrane. This allows not only a more realistic build-up of potential to occur to allow things like temporal summation to work properly, but also allow us to emulate myelination, in which electrotonic potential is subjected to a change in attenuation due to higher resistance and lower capacitance of the plasma membrane.
Below is a membrane potential graph generated from a simple structure consisting of 3 segments. The first segment is clamped with oscillating voltage, with structure 2 connected to 1, and 3 to 2. We can see the subsequent structures increase and decrease according to their distance from structure 1. The curve is controlled by the capacitance and resistance of the plasma membrane:
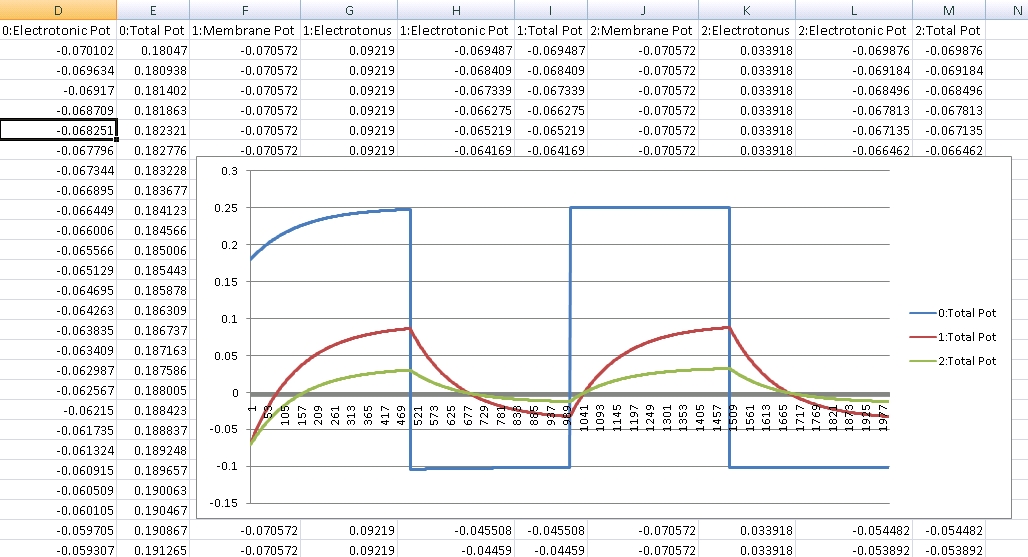
Note that membrane resistance is calculated via ionic permeability. This is a simple graph and the following posts will show some more interesting graphs with the effects of spatial summation and changes in resistance illustrated, but this one is very clear at showing the expected curve associated with a capacitor.
Next post illustrates the completion of Hodgekin-Huxley calculations for voltage-gated ion channels.